2018 Gender pay reporting
This is the second year that Swinton has disclosed its gender pay gap. By reporting our gender pay gap, it helps us understand the root causes so that we can take proactive steps to close the gap. The table below shows the overall mean and median hourly pay gaps.
Difference between men and women
Mean Median
12.2% 9.5%
Pay gap (hourly rate)
Since April 2017, our average (mean) pay gap has narrowed from 13.8% to 12.2% in April 2018. Whilst we are pleased with this improvement, we acknowledge we still have more work to do.
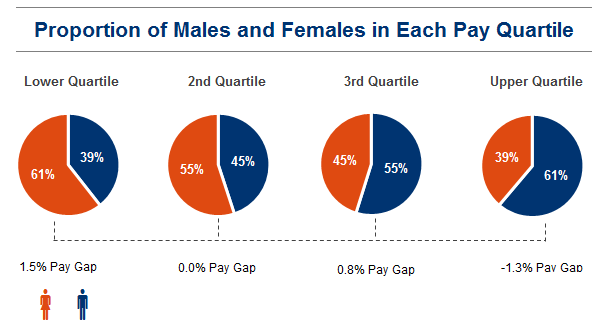
Our analysis below shows that our pay gap occurs because there are more men working in senior roles, compared to women. In 2018, Swinton’s overall colleague population was equally split with 50% male and female representation. However, the charts below show the proportion of males and females employed within each pay quartile. Within the lowest pay group or quartile, there are disproportionately more females than males. Whereas in the highest paid group, or quartile, there are disproportionately more males than females.

We have also calculated the average (mean) pay gap within each of these quartiles, or pay groups. This helps to understand if there are difference in terms of how we pay men and women within each of these group.
The pay gap in the lowest quartile is 1.5%. Within the 2nd and 3rd quartiles, the pay gap is less than 1% whilst in the highest paid quartile, the average female rate of pay is 1.3% higher than those of the males in that quartile. The pay gap in each quartile has narrowed since last year and suggests that the overall pay gap is a result of the composition of our workforce rather than a pay one.
If we were able to get equal representation of males and females in each of the pay quartiles, then our overall average (mean) gender pay gap would be -0.1%.
Bonus
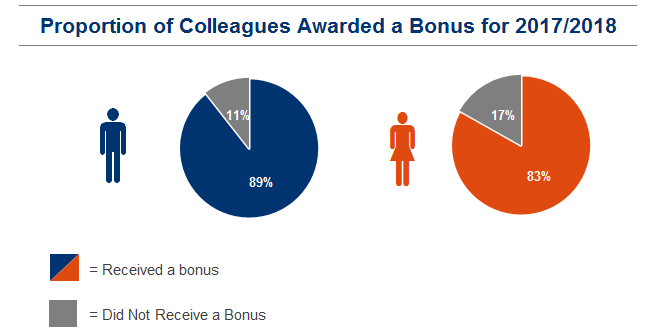
Every colleague has a part to play in contributing to Swinton’s success and we believe it is important that everyone is rewarded fairly for the contribution they make to the performance of our business. The table below shows the mean and median pay gap for all bonuses earned in the 12 month period up until 5th April 2018.
Difference between men and women
Mean Median
31.1% 17.5%
Bonus gap
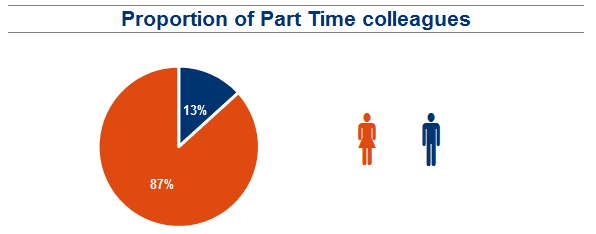
Swinton promotes flexible working opportunities with over 21% colleague working part time. However, as shown in the table below, of those colleagues working part time, 87% of them are female.


Declaration
We confirm that Swinton’s gender pay gap calculations are accurate.


Managing Director
Hilary Burns
People Director